Device Monitoring
Remote device monitoring is crucial for constantly tracking the health of your IoT devices remotely, so that corrective actions can be taken immediately.
SocketXP provides two options to monitor your devices remotely:
- Device Status Monitoring
- Device Resource Monitoring
Device Status Monitoring
SocketXP Device Status Monitoring feature provides you the ability to monitor your remote device status(online/offline). SocketXP can be configured to send device status change alerts to a user registered public webhook URL.
For example, if your team uses Slack app for collaboration, and if you want to receive device status change notifications in your Slack app channel, you could create a Slack Incoming Webhook and configure SocketXP to use the webhook to send device status change notifications.
There are many team collaboration apps(not just Slack) that support and provide public webhooks. You could register the app's webhook with SocketXP to receive device status change notifications.
You can also register your custom built IoT controller or dashboard app's webhook API with SocketXP to receive device status change alerts.
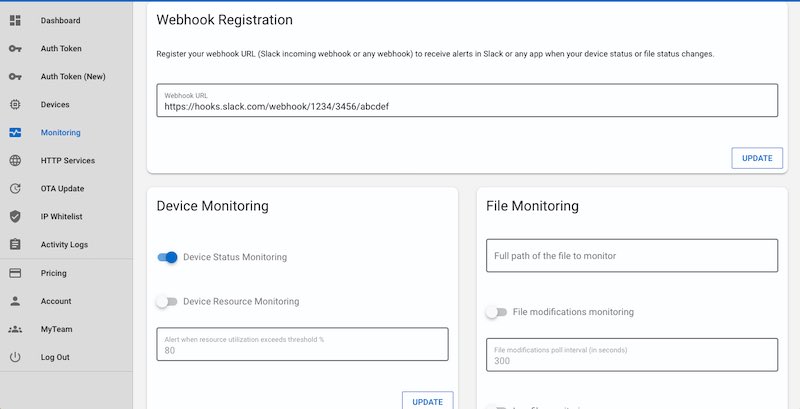
To receive webhook notifications, you need to register the public webhook URL of your application with the SocketXP gateway. This will turn on Device Status Monitoring for all the devices.
Go to the SocketXP web portal's monitoring section, where you will register the public webhook URL of your app and click update.
SocketXP gateway will send the following device status change notification through the app's webhook URL, whenever the device/tunnel goes up or down:
Tip
All the alerts generated can be viewed from the "Activity Logs" section in the SocketXP Web Portal.
Device Resource Monitoring:
Device Resource Monitoring provides you the ability to monitor your device resource utilization such as CPU usage, memory usage, disk usage and trigger a webhook alert when the resource utilization exceeds a configured threshold value.
By default, Device Resource Monitoring feature is disabled. Use the below configuration to enable Device Resource Monitoring feature on the device:
{
    "device_monitoring": true,
    "device_monitoring_threshold": 40.0,
    "tunnels": [
        {
            "destination": "tcp://127.0.0.1:22"
        }
    ]
}
device_monitoring_threshold field is 80.0%. To set it to a non-default value, use the device_monitoring_threshold configuration field to set a custom value.
You'll receive webhook alerts as shown below when the CPU or Memory or Disk utilization exceeds the configured device_monitoring_threshold value.
    {
        "DeviceId": "1234aaaa-bbbb-ccccc-ddddd1234",
        "DeviceName": "Sensor123",
        "CPUUsagePercent": "91",
        "MemUsagePercent": "72",
        "DiskUsagePercent": "43"
    },
Note
- Device resource monitoring alerts are throttled to a 5 minute window - meaning not more than 1 alert will be sent in any 5 minute window for a given device.
- The webhook URL registered in the Device Status Monitoring section above, will be used to send the Device Resource Monitoring alerts.
- Device status monitoring feature is available from agent version 1.3.10. Device resource monitoring feature is available from agent version 2.0.1 onwards.
